KPI & Performance
This documentation is actively maintained. Features described here may change as the platform evolves. Last reviewed: February 2025.
The KPI (Key Performance Indicators) page provides performance analytics for individuals, teams, and departments. Only Administrators, Department Leads, and Team Leads can access this page.
Your Role on This Page
- Admin
- Department Lead
- Team Lead
- Member
As an Admin, you can view organization-wide KPIs for all departments, leaderboards, and audit trails. You have access to all performance metrics across the entire organization.
As a Department Lead, you can view department KPIs and team comparisons. You can see performance metrics for all teams within your department.
As a Team Lead, you can view team KPIs and individual member metrics. You can monitor your team's performance and see how each member is performing.
As a Member, you can view your personal KPI scores and trends. You can track your own performance metrics and see how you're improving over time.
Navigation
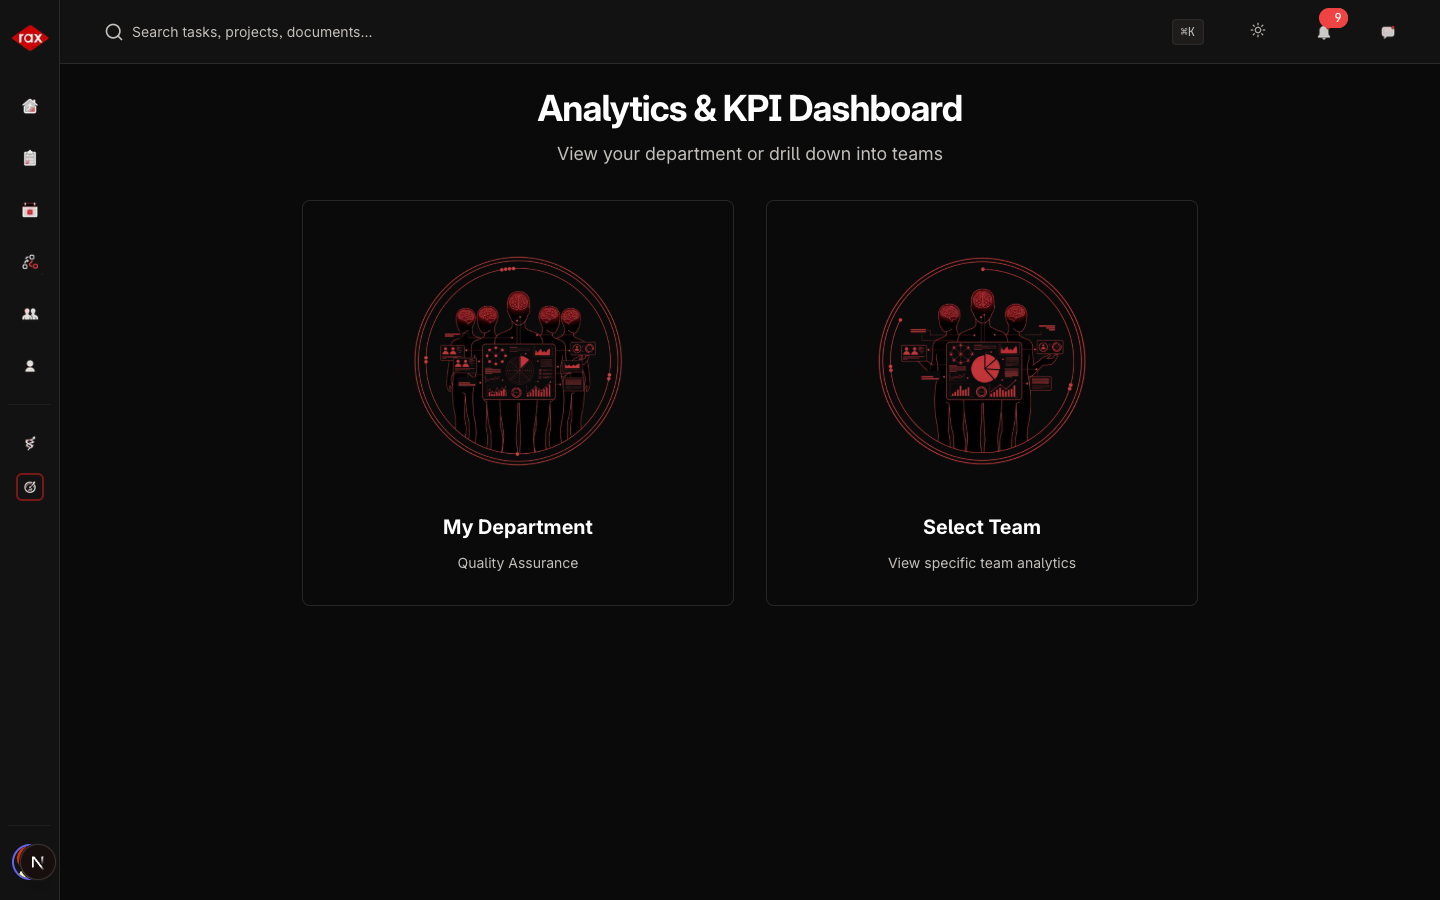
When you open the KPI page, what you see depends on your role:
| Role | Options |
|---|---|
| Administrator | Choose between Overall, any Department, or any Team |
| Department Lead | Choose between your Department overview or a specific Team |
| Team Lead | Automatically shown your team's analytics |
Overview Dashboard
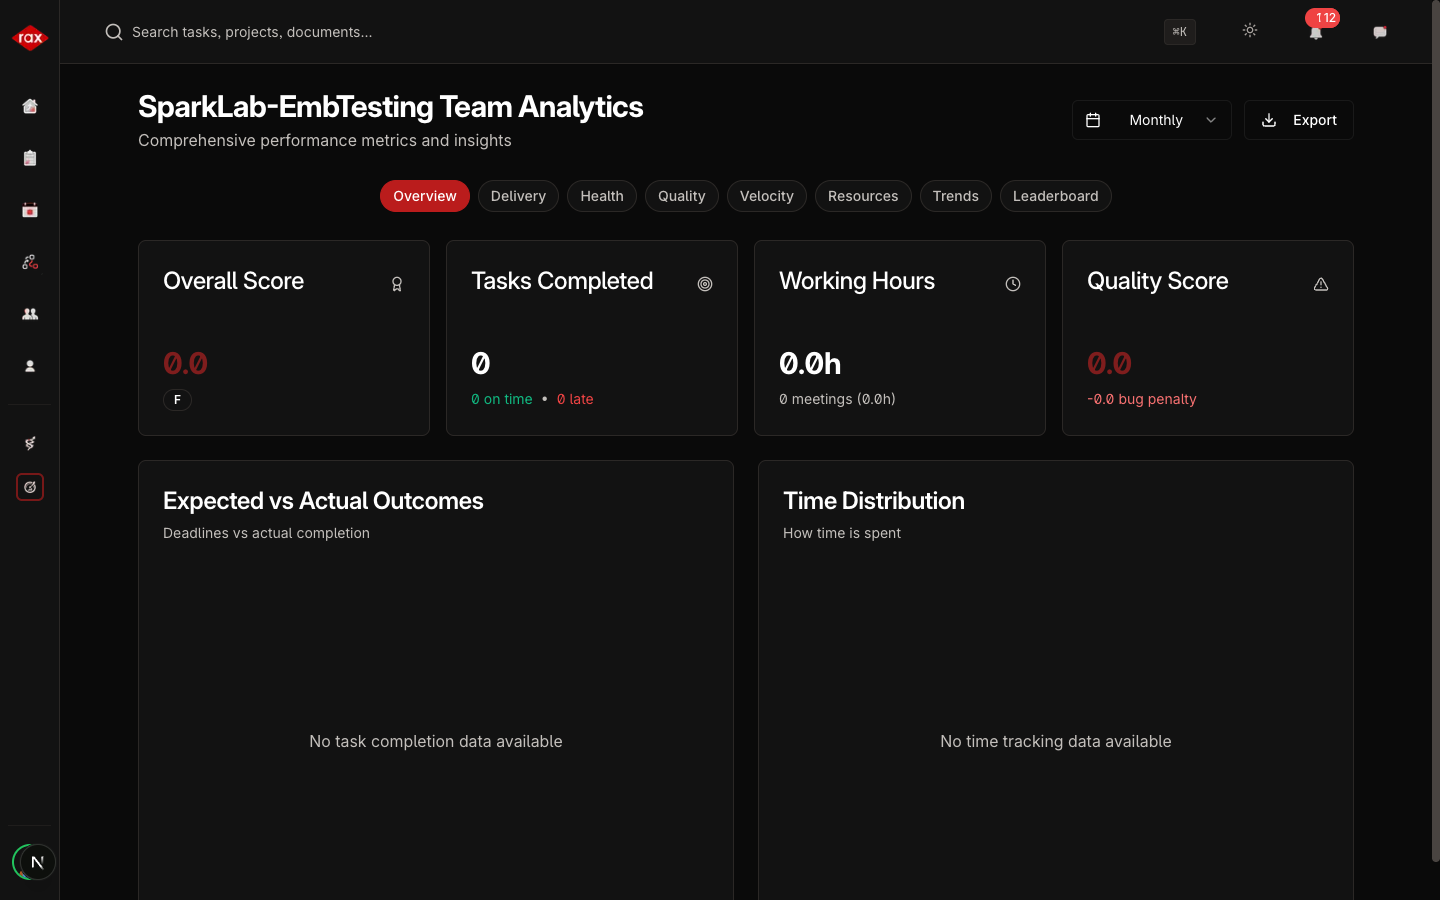
The main KPI view shows:
Performance Score
A single score from 0 to 100 with a grade:
| Grade | Score Range |
|---|---|
| Excellent | 90–100 |
| Good | 75–89 |
| Average | 60–74 |
| Below Average | 40–59 |
| Poor | Below 40 |
Key Metrics
| Metric | Description |
|---|---|
| Tasks Completed | Number of tasks finished in the period |
| On-Time Rate | Percentage of tasks completed before their due date |
| Working Hours | Total hours tracked via task timers |
| Quality Score | Score adjusted for bugs (bug penalty applied) |
Charts
- Expected vs Actual — Bar chart comparing planned vs actual performance
- Time Distribution — Pie chart showing time split between Online, Away, Meetings, and Leave
- Department Lead
- Team Lead
- Member
Period Filters
You can view KPI data for different time periods:
- Daily — Today's performance
- Weekly — This week
- Monthly — This month
- Quarterly — This quarter
- Yearly — This year
Exporting Reports
Click the Export PDF button to generate a downloadable report with all charts and metrics for the selected period and scope.
KPI scores are calculated based on task completion, time tracking, and quality metrics. Encourage your team to use task timers consistently for accurate reporting.